Odden history, 1972-1994

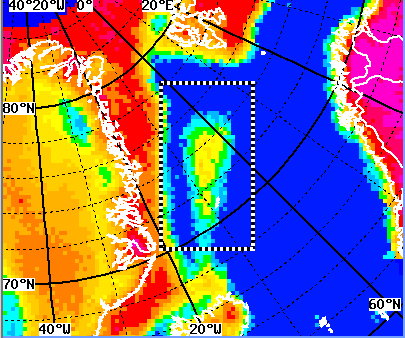
NIMBUS-7 SMMR derived total ice concentrations from March 31, 1979.
The rectangle in the centre shows the definition of the Greenland Sea/Odden area that has been used in this study. Colours indicate ice concentrations, blue is no ice and red is close to 100% ice. Colours over land and land-ice has no meening.


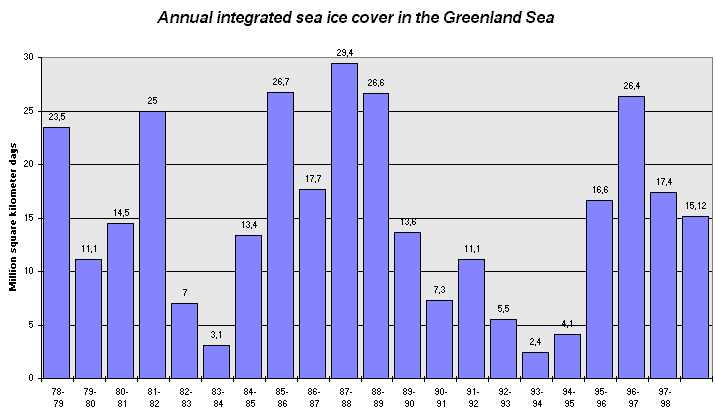
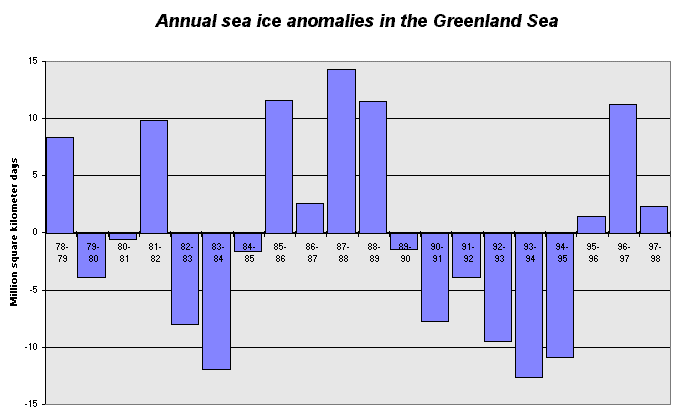
Bar graph showing the integrated amount of ice in most winters since 1978-79.
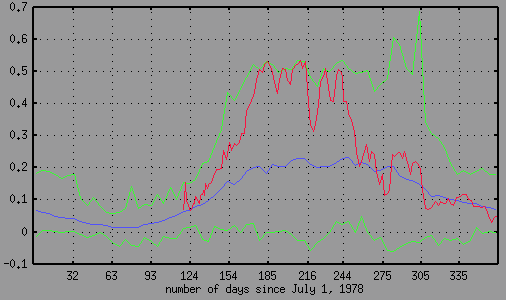
Daily ice concentrations from the area shown above has been extracted from the time period October 1978 to June 1998. The plot below shows results from the 1978-79 winter in red, and the green curves show ice concentrations in the minimum and the maximum year of the perion. The blue curve shows average ice conditions.

Click on the plot above to download a postscript file with plots for each of the years in the period. Note that orientation of the plots are landscape.
Leif Toudal <ltp@emi.dtu.dk>
Last modified: Thu Feb 18 23:03:33 1999


